
Surreal Data Visualization City
关于这幅 Data Visualization City Artwork
进一步了解这张图像的主题、风格与细节。
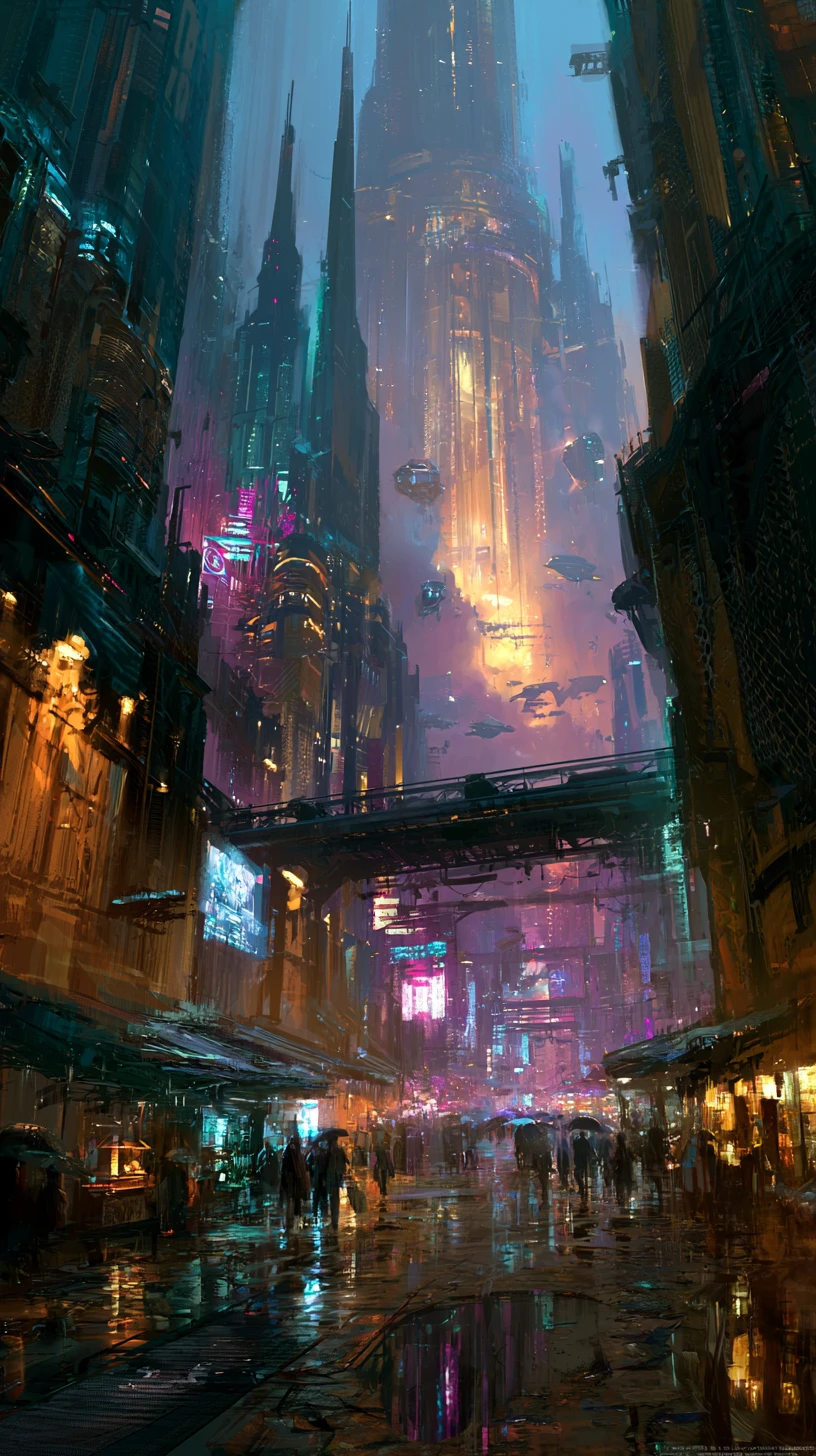
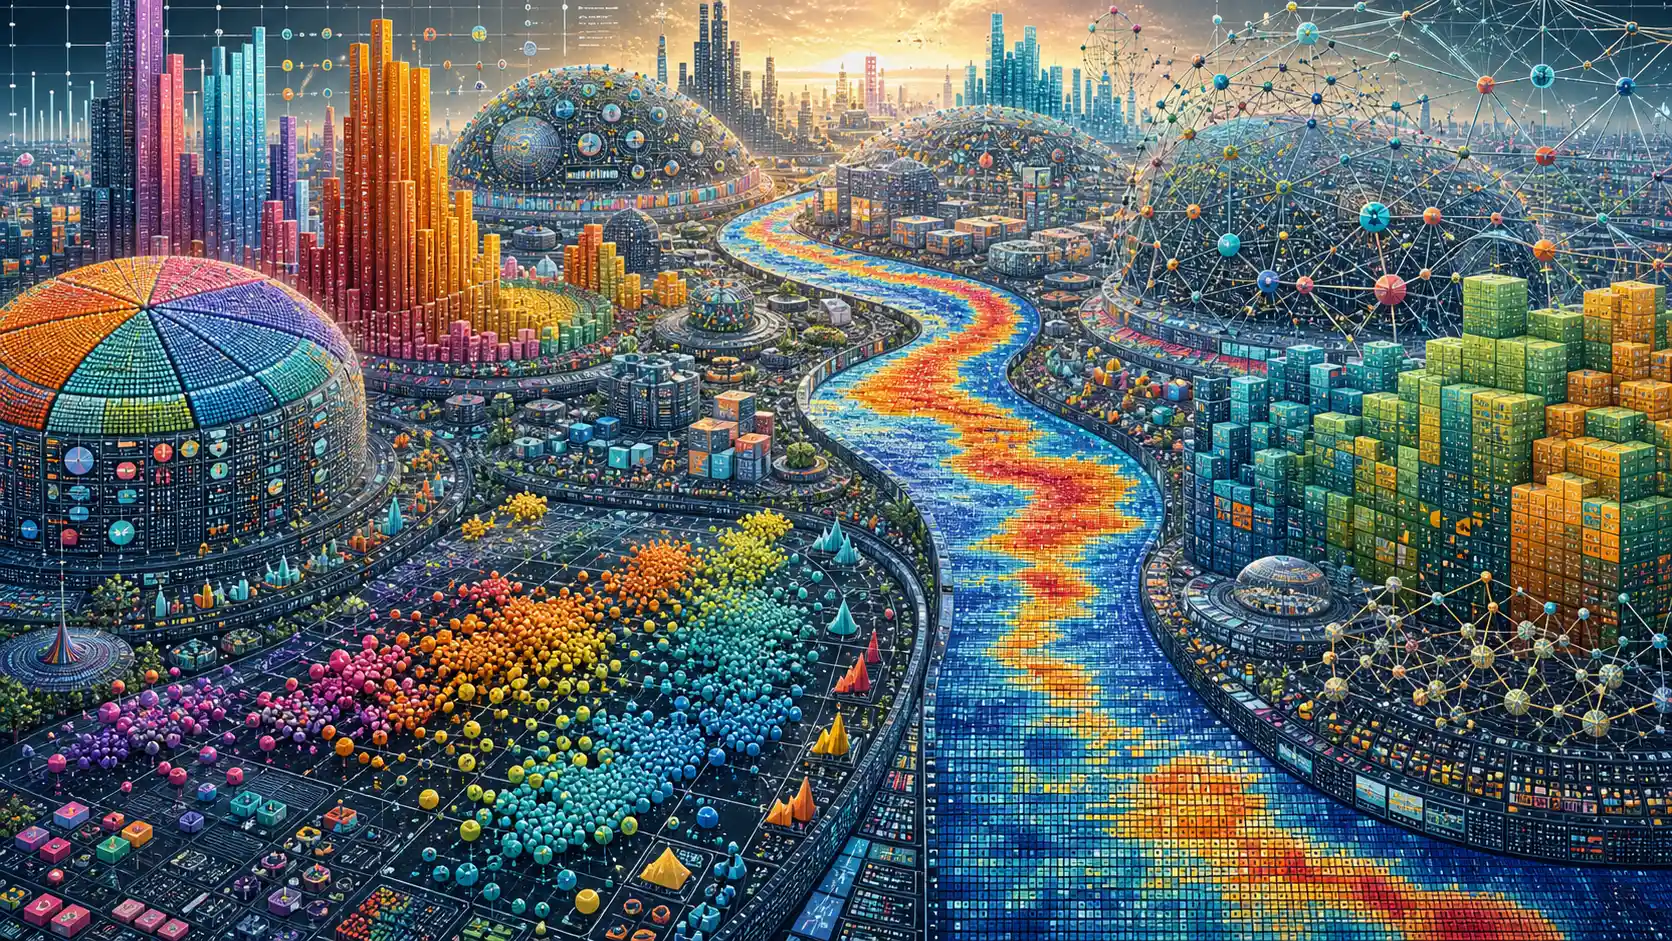
The artwork imagines a city where buildings and landscapes take the form of data visualizations. Pie charts shape domes, histogram bars become towers, and scatterplots form gardens, while rivers follow heat map patterns.
The concept combines surreal city architecture with microscopic analytical symbols, from database icons to graph nodes. Its intricate, information-based look suits a technology-themed poster or a speculative fiction book cover.
创作风格与细节
赋予这件作品独特观感的细节。
Subject
A city built from visualized information, with chart-based architecture and landscapes made from data patterns.
Architectural Features
Pie chart domes and histogram towers give the city a distinctive structure, while treemap forests extend the data-driven design.
Visual Style
The surreal concept turns analytical graphics into an impossible urban environment, blending familiar city forms with data imagery.
Materials & Textures
Surfaces use microscopic informational marks, including database icons, binary fragments, chart fragments, graph nodes, and algorithmic linework.
创作你自己的 Data Visualization City Artwork
以这件作品的视觉想法为起点,为场景加入你自己的方向。
基于这件作品的 AI 建议。
Related images