
Dark Mode Data Dashboard Illustration
关于这幅 Dark Analytics Dashboard Illustration
进一步了解这张图像的主题、风格与细节。
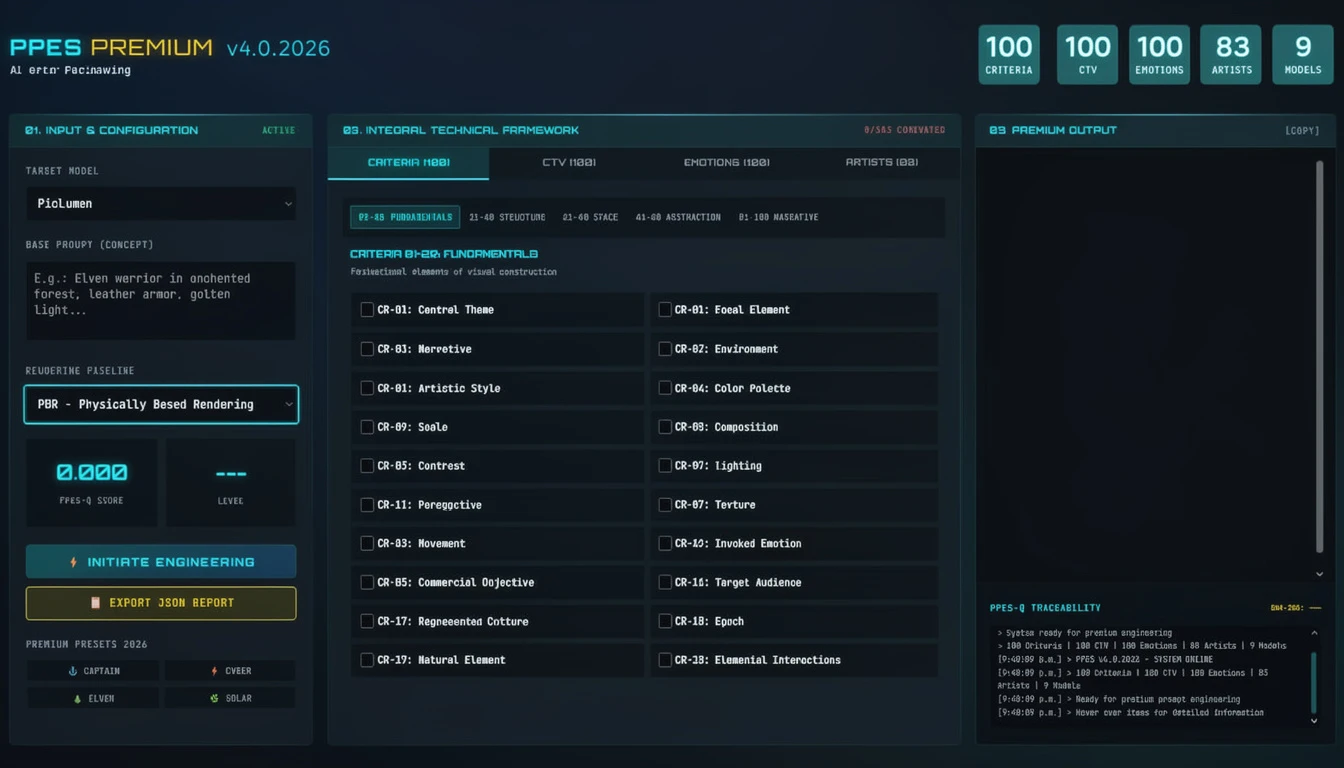
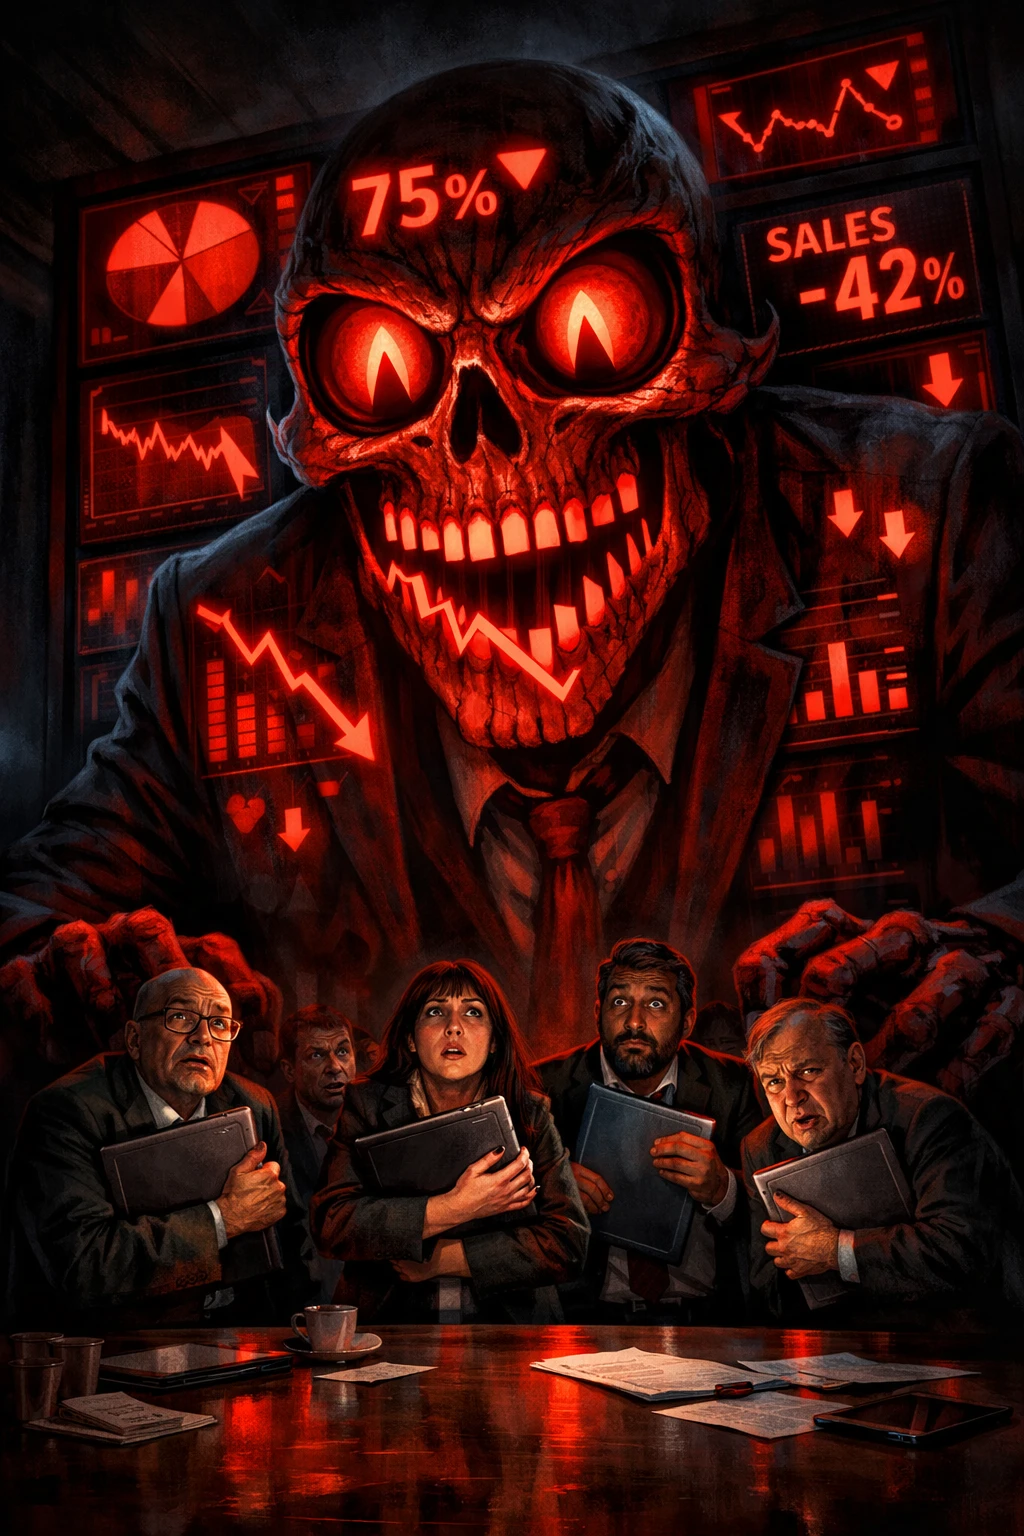
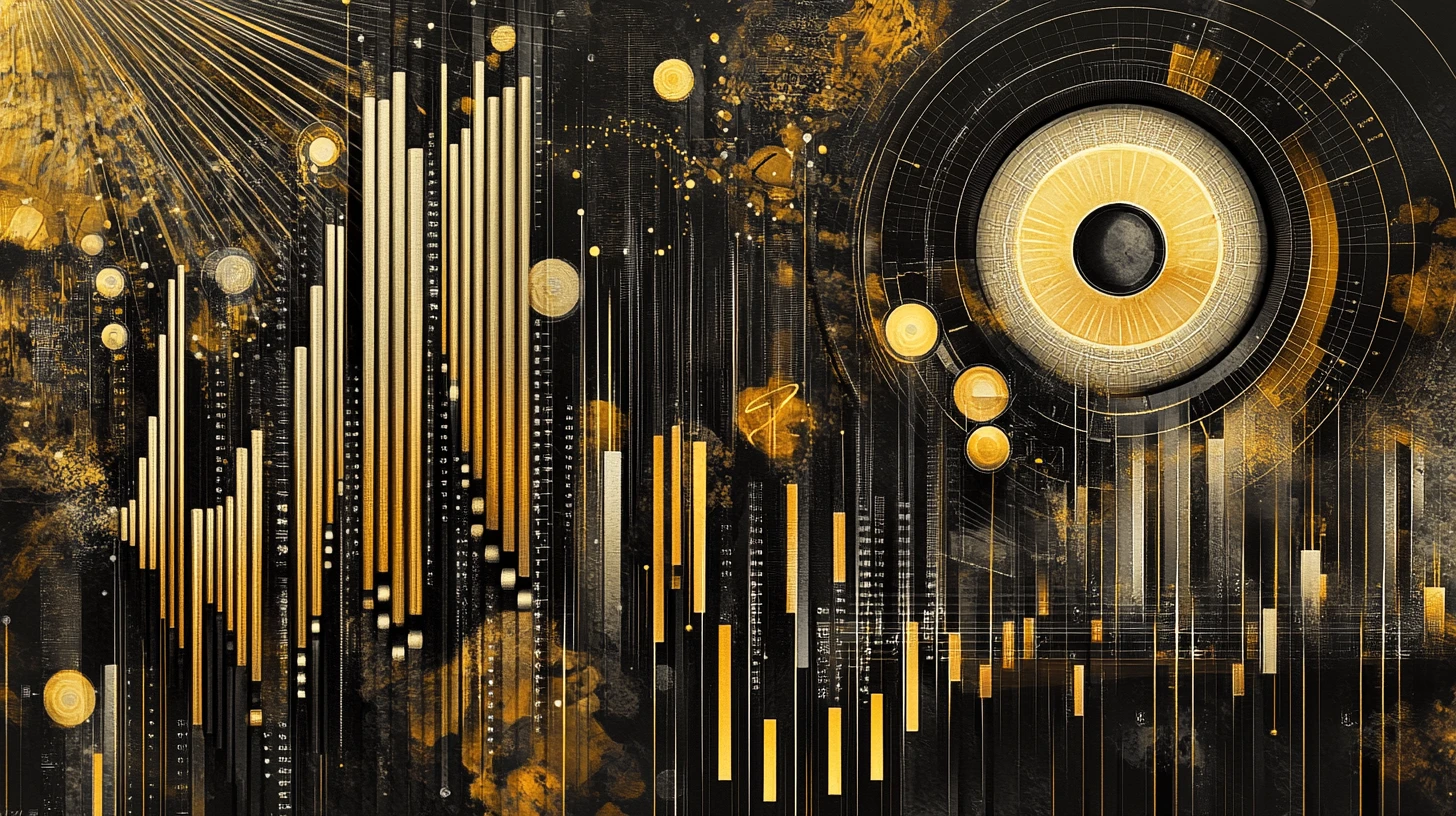
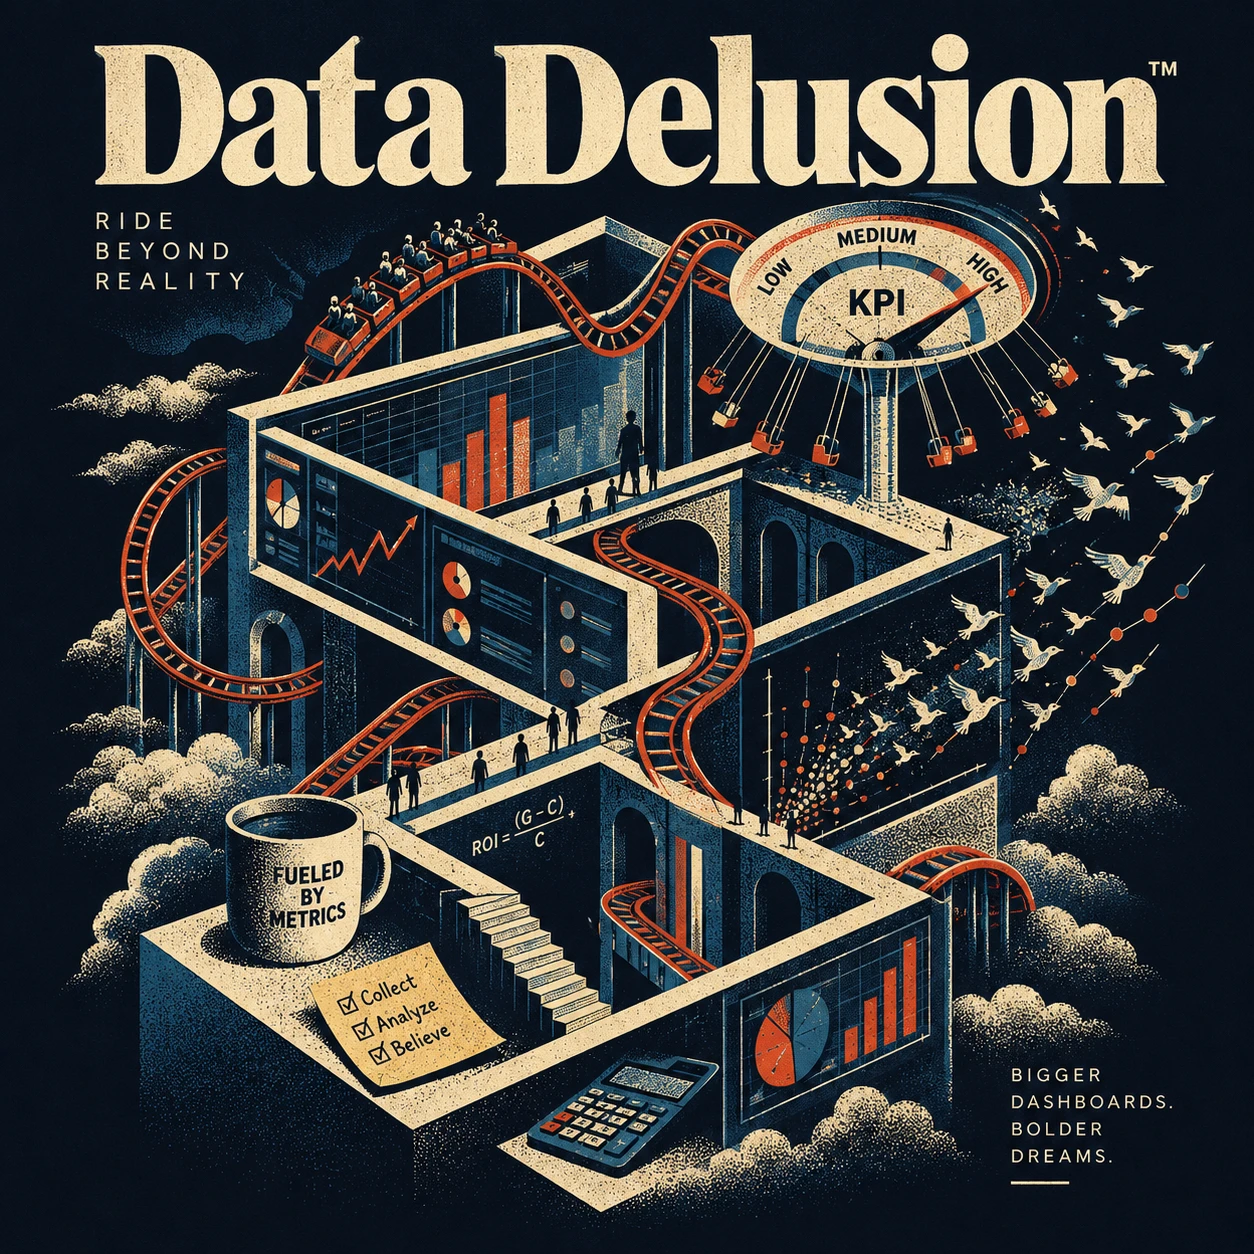
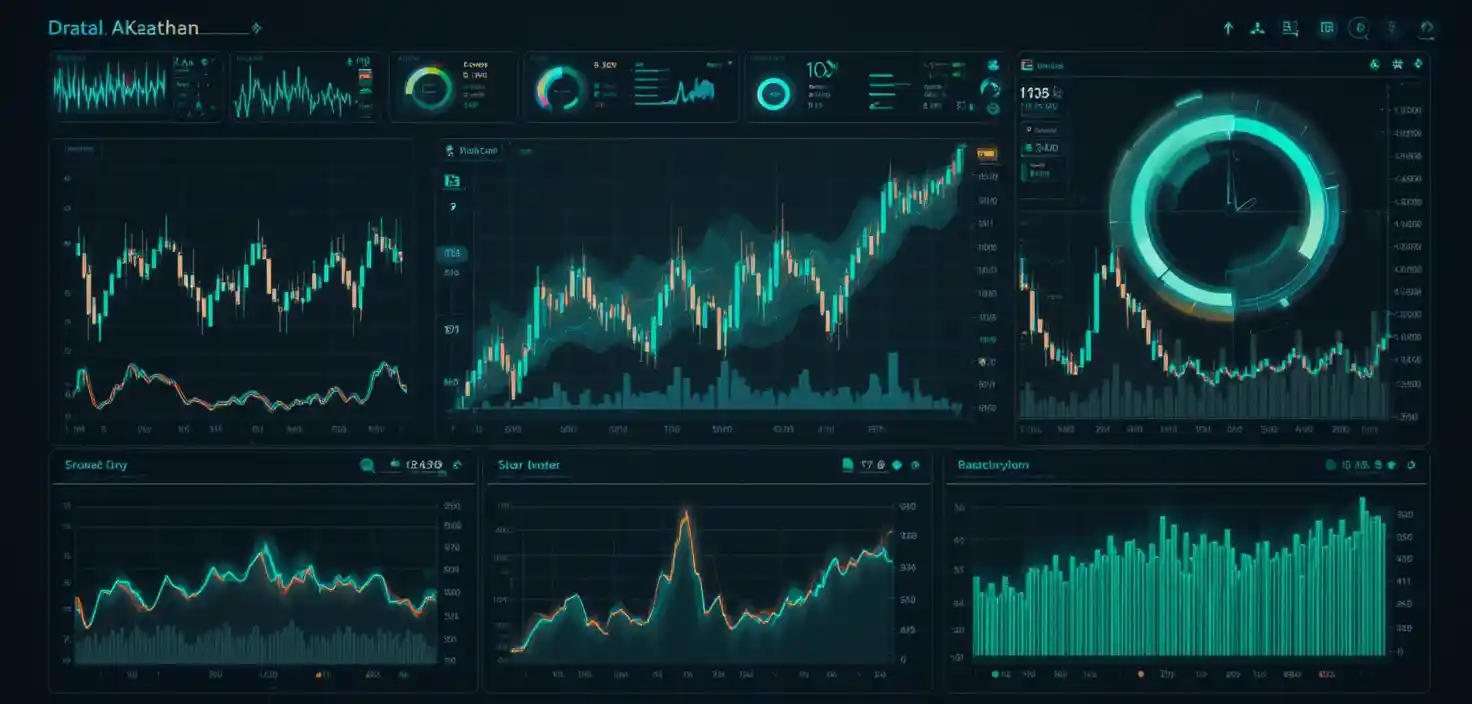
A wide analytics dashboard fills a dark interface, bringing together candlestick stock charts, heatmaps, and progress rings. Soft white and emerald green indicators mark the data across a charcoal gray setting in a broad horizontal layout.
The sleek tech magazine aesthetic gives the concept a focused, analytical feel. It could suit a finance product landing page or a technology publication cover where data visualization is central to the design.
创作风格与细节
赋予这件作品独特观感的细节。
Subject
The main subject is a data analyst dashboard displaying stock charts, heatmaps, progress rings, and other complex statistics.
Visual Style
A sleek tech magazine cover approach gives the dashboard a polished, high-fidelity visualization style with an analytical focus.
Composition
The 1500-by-500 aspect ratio suggests a broad horizontal layout, with multiple data visualizations arranged across the interface.
Color Palette
Charcoal gray provides the base, while soft white and emerald green indicators bring contrast to the dark interface.
创作你自己的 Dark Analytics Dashboard Illustration
以这件作品的视觉想法为起点,为场景加入你自己的方向。
基于这件作品的 AI 建议。
Related images