Surreal Dashboard Orchestra Artwork
关于这幅 Orchestra Dashboard Artwork
进一步了解这张图像的主题、风格与细节。
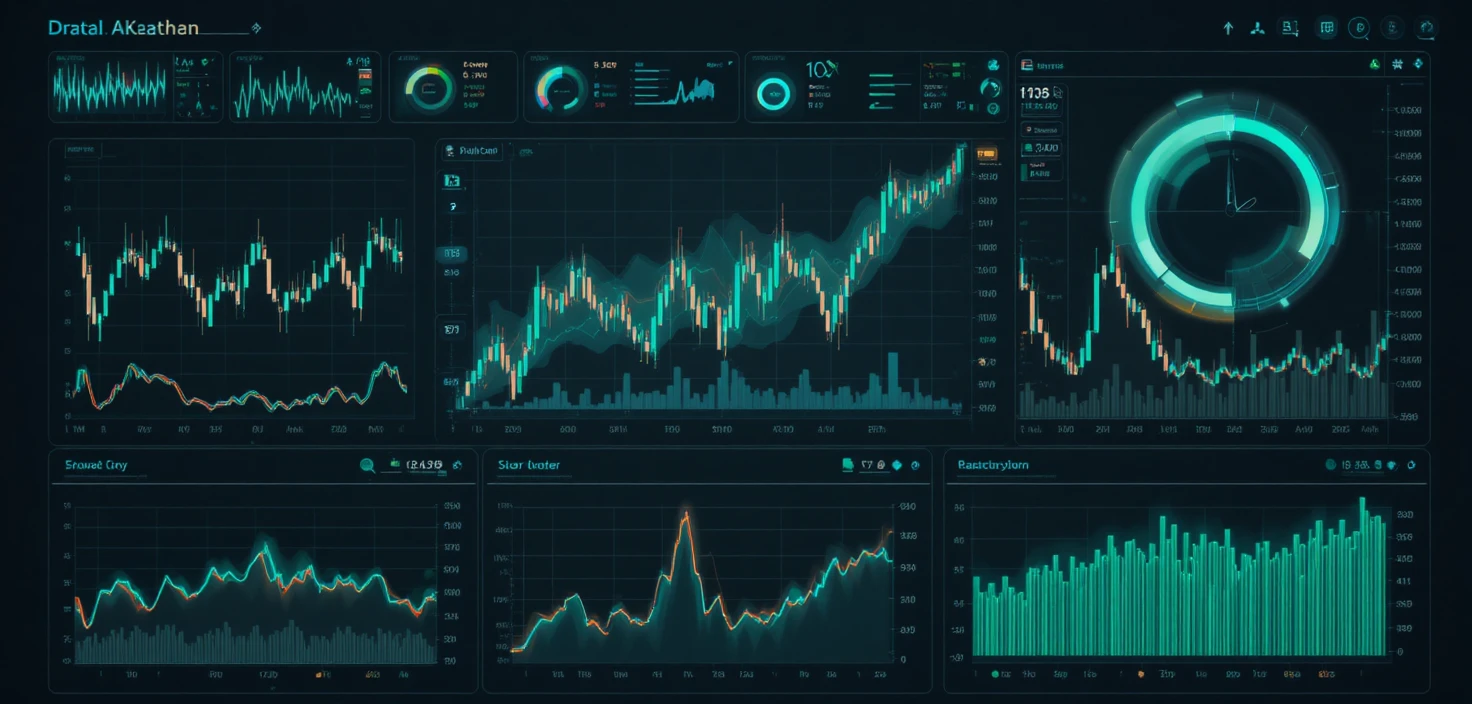
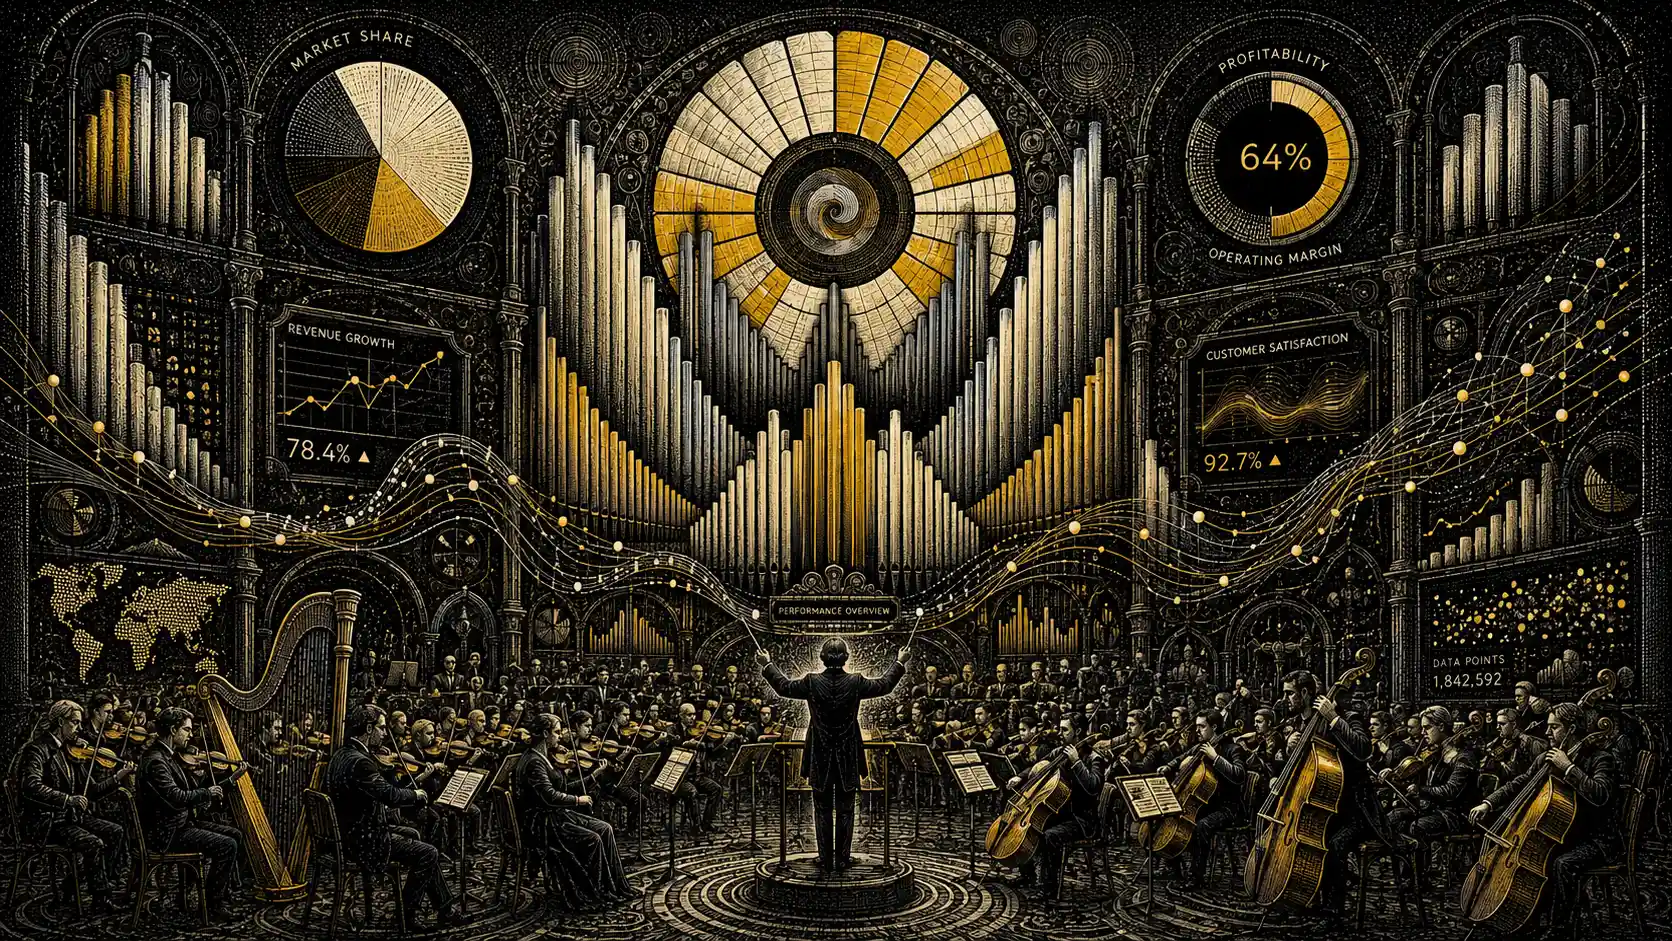
This artwork recasts an executive dashboard as an orchestra, with bar charts rising like cathedral organ pipes and pie charts opening into stained-glass windows. Line graphs flow like violin strings, bringing familiar data displays into a surreal musical setting.
Engraved scientific illustration meets surreal fine art, with stippled dots shaping gradients and hidden optical spirals adding visual complexity. The concept could suit a business presentation cover or an editorial poster about data and creativity.
创作风格与细节
赋予这件作品独特观感的细节。
Subject
An executive dashboard becomes an orchestra, turning data displays into musical and architectural forms.
Art Style
The concept combines the precise look of engraved scientific illustration with surreal fine art.
Illustration Technique
Stippled dots are intended to build the gradients, while subtle optical spirals add a hidden pattern.
Color Palette
Black, ivory, and yellow define the palette, keeping the visual concept focused on three contrasting tones.
创作你自己的 Orchestra Dashboard Artwork
以这件作品的视觉想法为起点,为场景加入你自己的方向。
基于这件作品的 AI 建议。
Related images