
Surreal Data Circus with a Ringmaster and Acrobats
About This Data Circus Illustration
A closer look at the subject, style and details in this image.
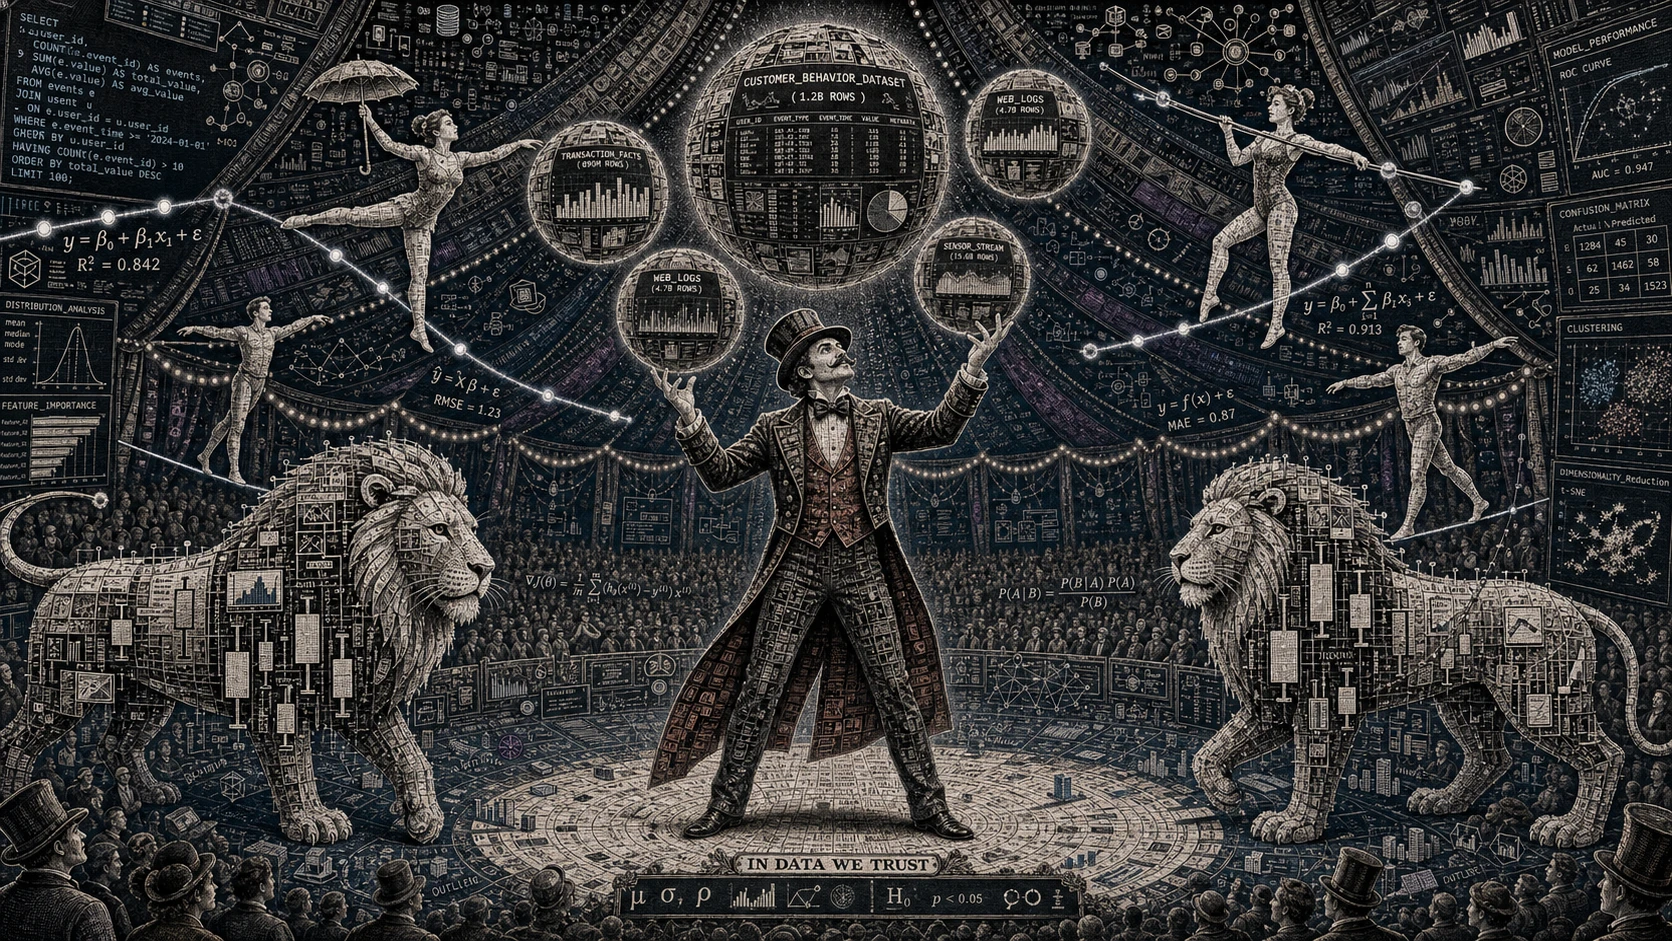
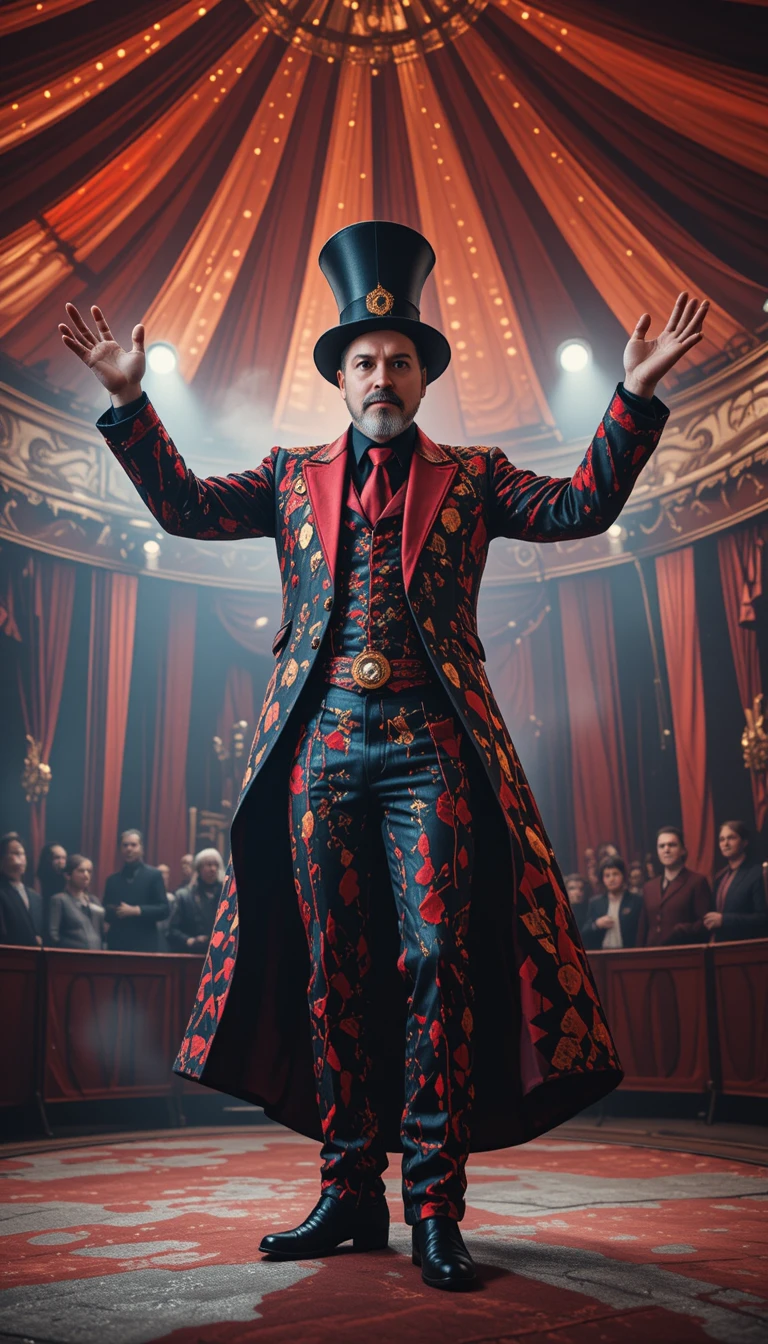
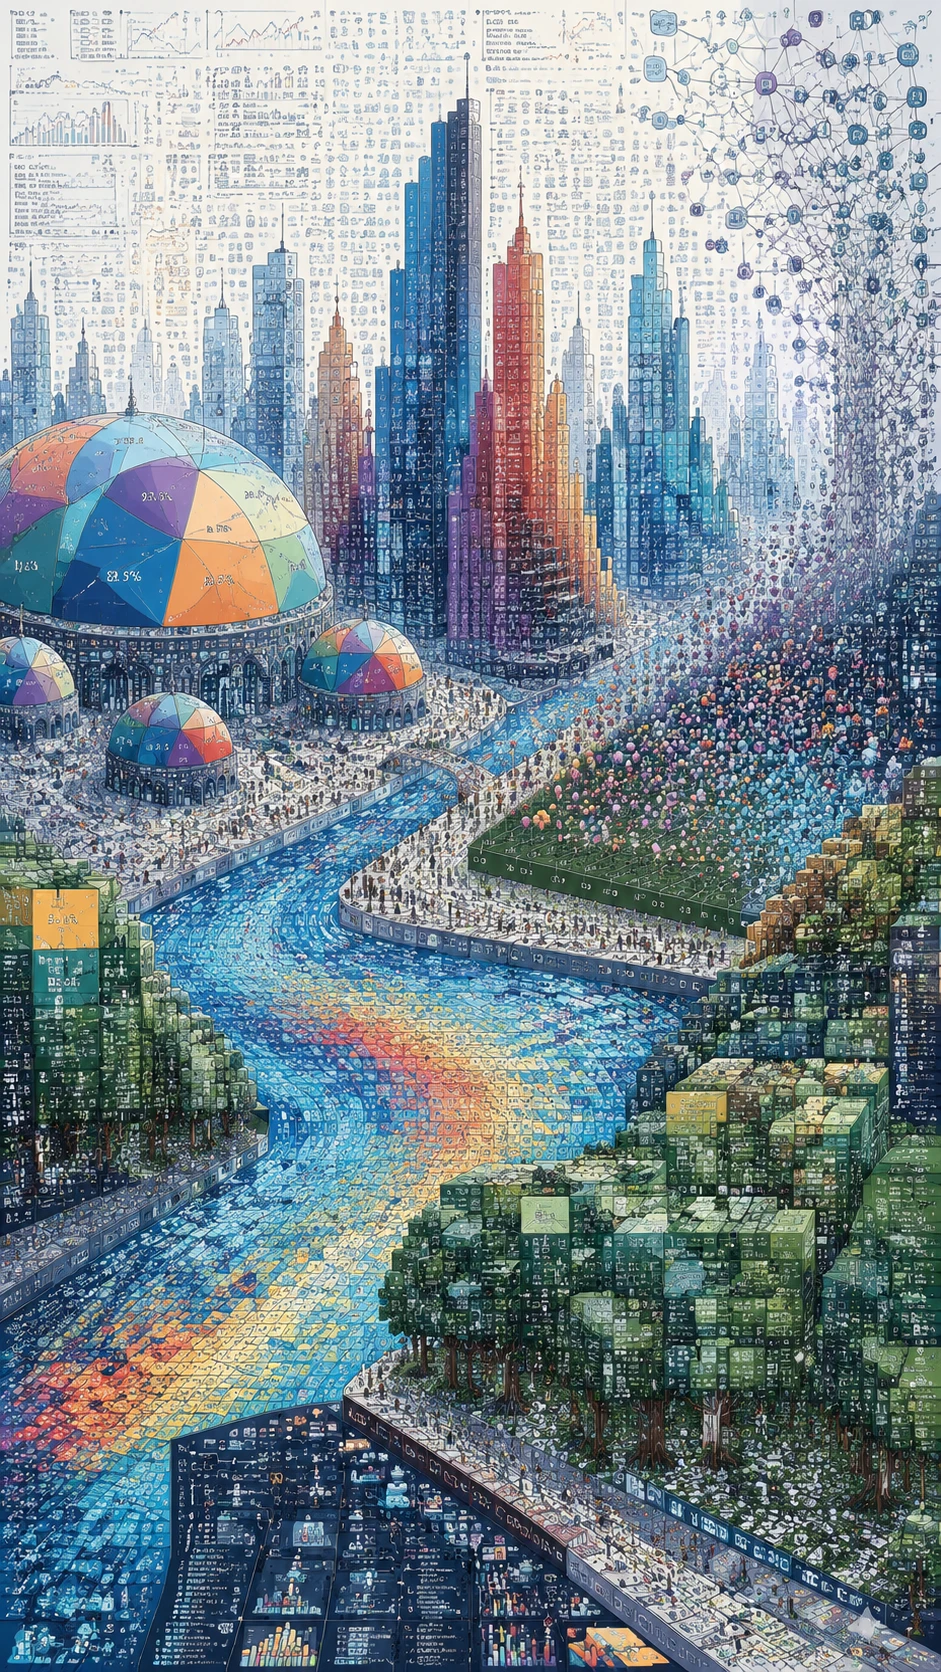
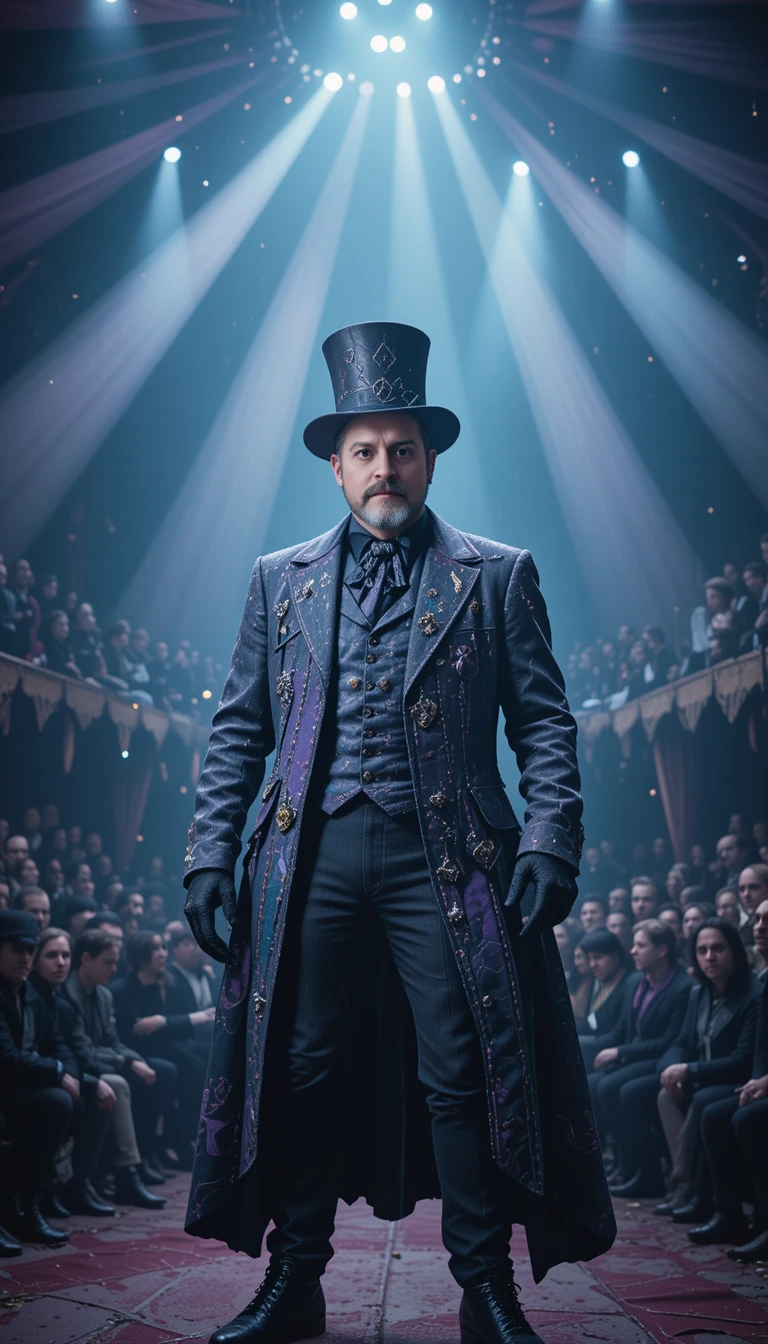
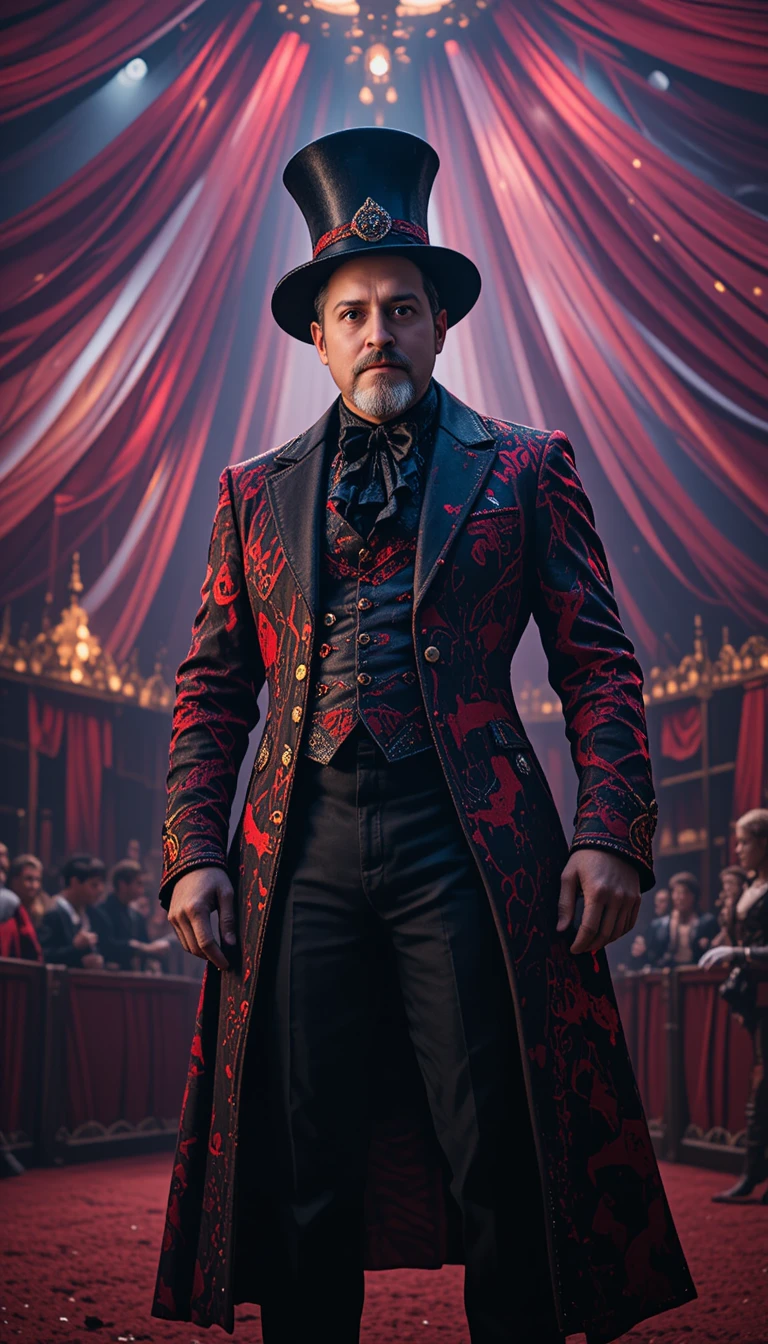
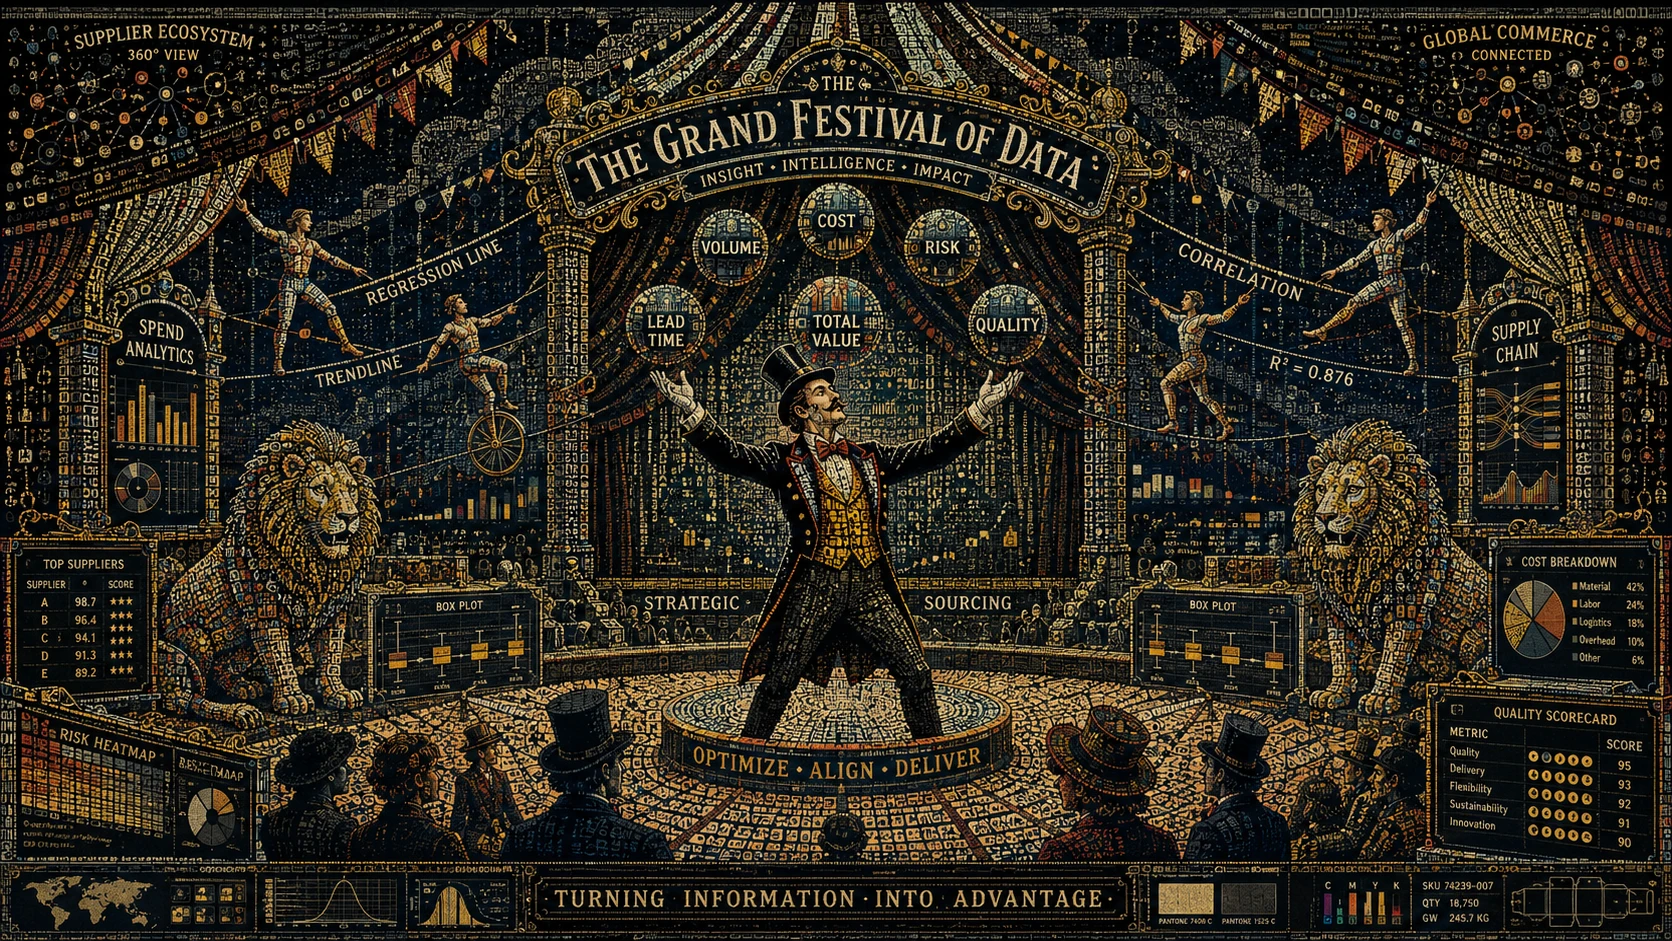
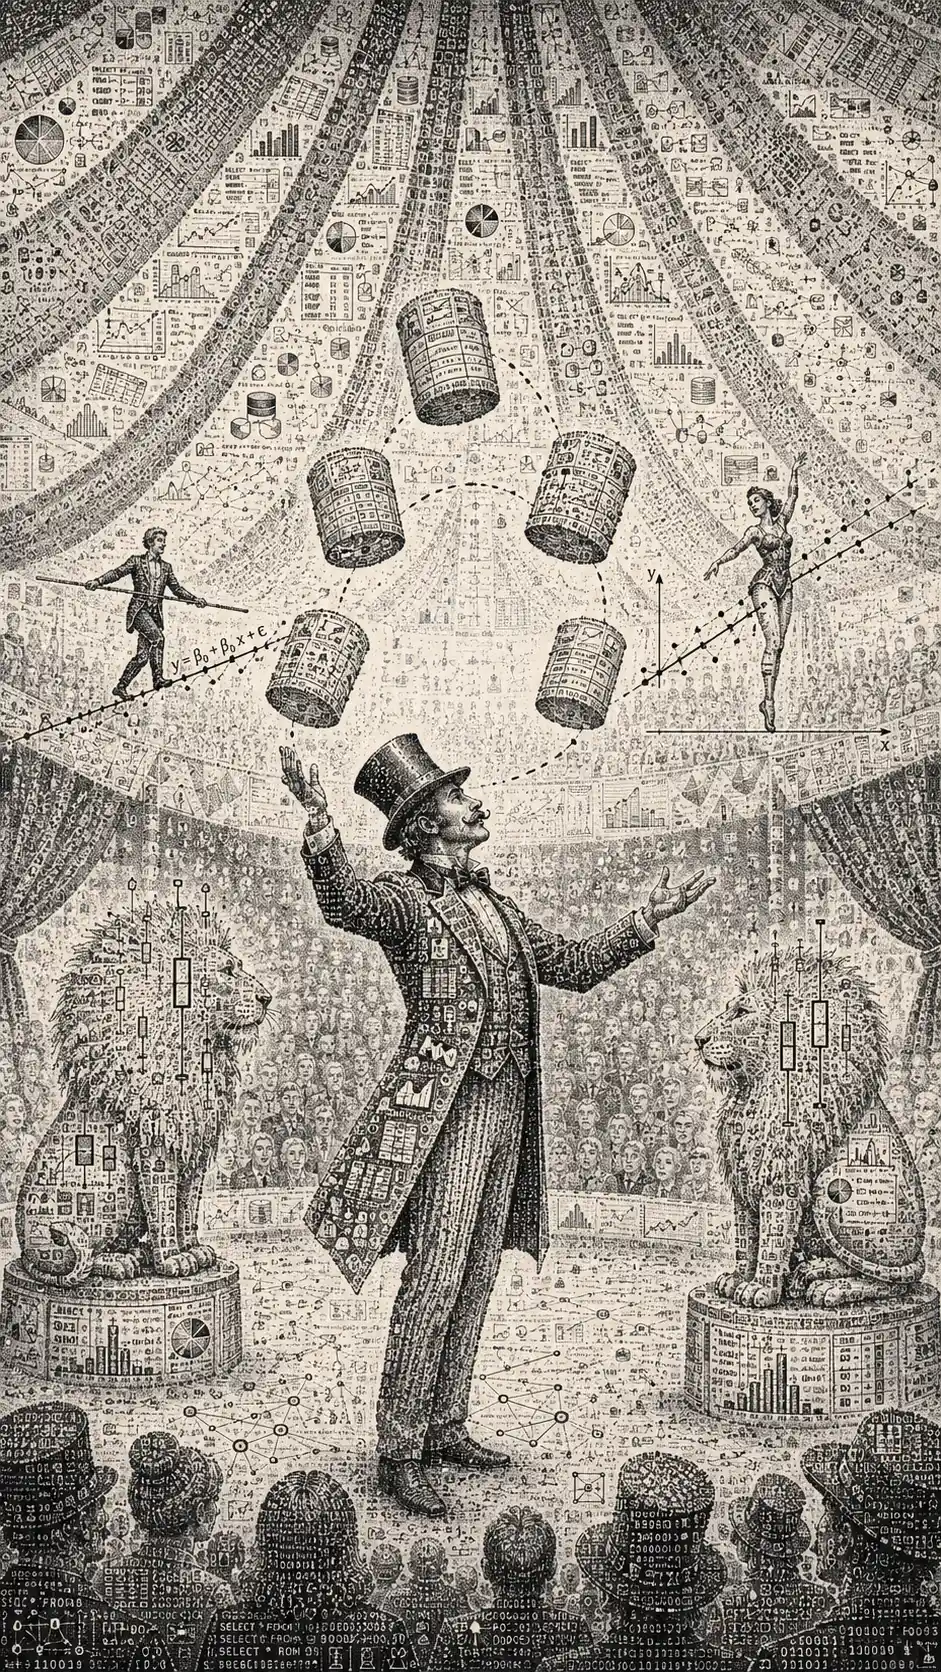
The concept sets a ringmaster juggling giant datasets in a circus alongside acrobats balancing on regression lines and lions formed from box plots. The tent fabric is woven from dashboards, while tiny statistical symbols take the place of ordinary stippling.
Surreal circus imagery meets dense data visualization, giving the scene an analytical twist. Its mix of performance and chart-based imagery suits a statistics-themed poster or a book cover about data and computation.
Creative Style & Details
The details that give this artwork its look.
Subject
A ringmaster juggles giant datasets as acrobats balance on regression lines and lions take the shape of box plots.
Art Style
The concept uses surrealism to turn statistical charts and data systems into performers, animals, and circus scenery.
Scene & Setting
A circus tent woven from dashboards frames the performance, bringing data visualization into a traditional show setting.
Illustration Technique
Microscopic analytical symbols replace ordinary stippling, with database icons, binary fragments, chart details, and miniature spreadsheets forming the texture.
Create Your Own Data Circus Illustration
Use this artwork's visual ideas as a starting point and give the scene your own direction.
AI suggestion based on this artwork.
Related images