
Data Visualization Cityscape with Chart Towers
About This Data Visualization City Artwork
A closer look at the subject, style and details in this image.
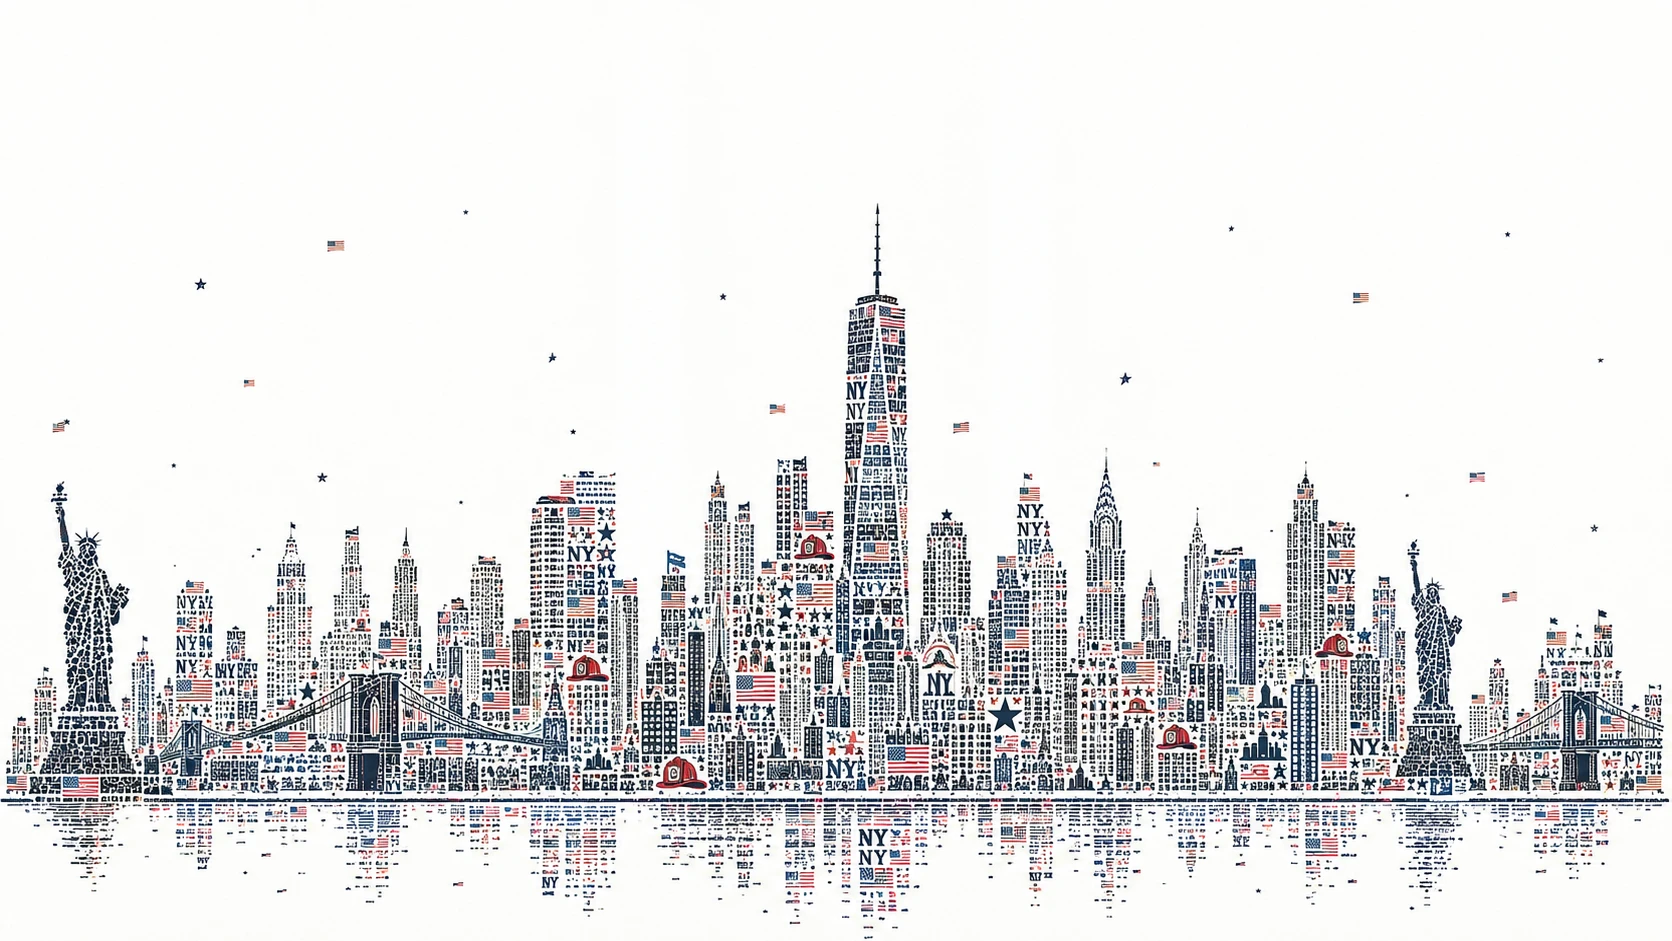
This city concept transforms buildings and landscapes into a living data visualization. Pie charts form domes, histogram towers rise above the streets, and scatterplot gardens, treemap forests, and heat map rivers shape the setting. Microscopic analytical symbols and chart fragments make up its imagined textures.
The idea combines urban architecture with statistical graphics and tiny traces of data, creating a structured, information-rich scene. It could suit a technology poster or a book cover about data, cities, or computational design.
Creative Style & Details
The details that give this artwork its look.
Subject
The central subject is a city where buildings and natural features take the form of data visualizations.
Architectural Features
Pie chart domes and histogram towers give the city its distinctive built forms.
Natural Elements
Scatterplot gardens, treemap forests, and heat map rivers extend the data theme across the landscape.
Materials & Textures
Microscopic analytical symbols, database icons, binary fragments, chart fragments, and graph nodes are imagined as the city's fine-grained textures.
Create Your Own Data Visualization City Artwork
Use this artwork's visual ideas as a starting point and give the scene your own direction.
AI suggestion based on this artwork.
Related images