
Surreal Data Visualization Orchestra
About This Data Orchestra Illustration
A closer look at the subject, style and details in this image.
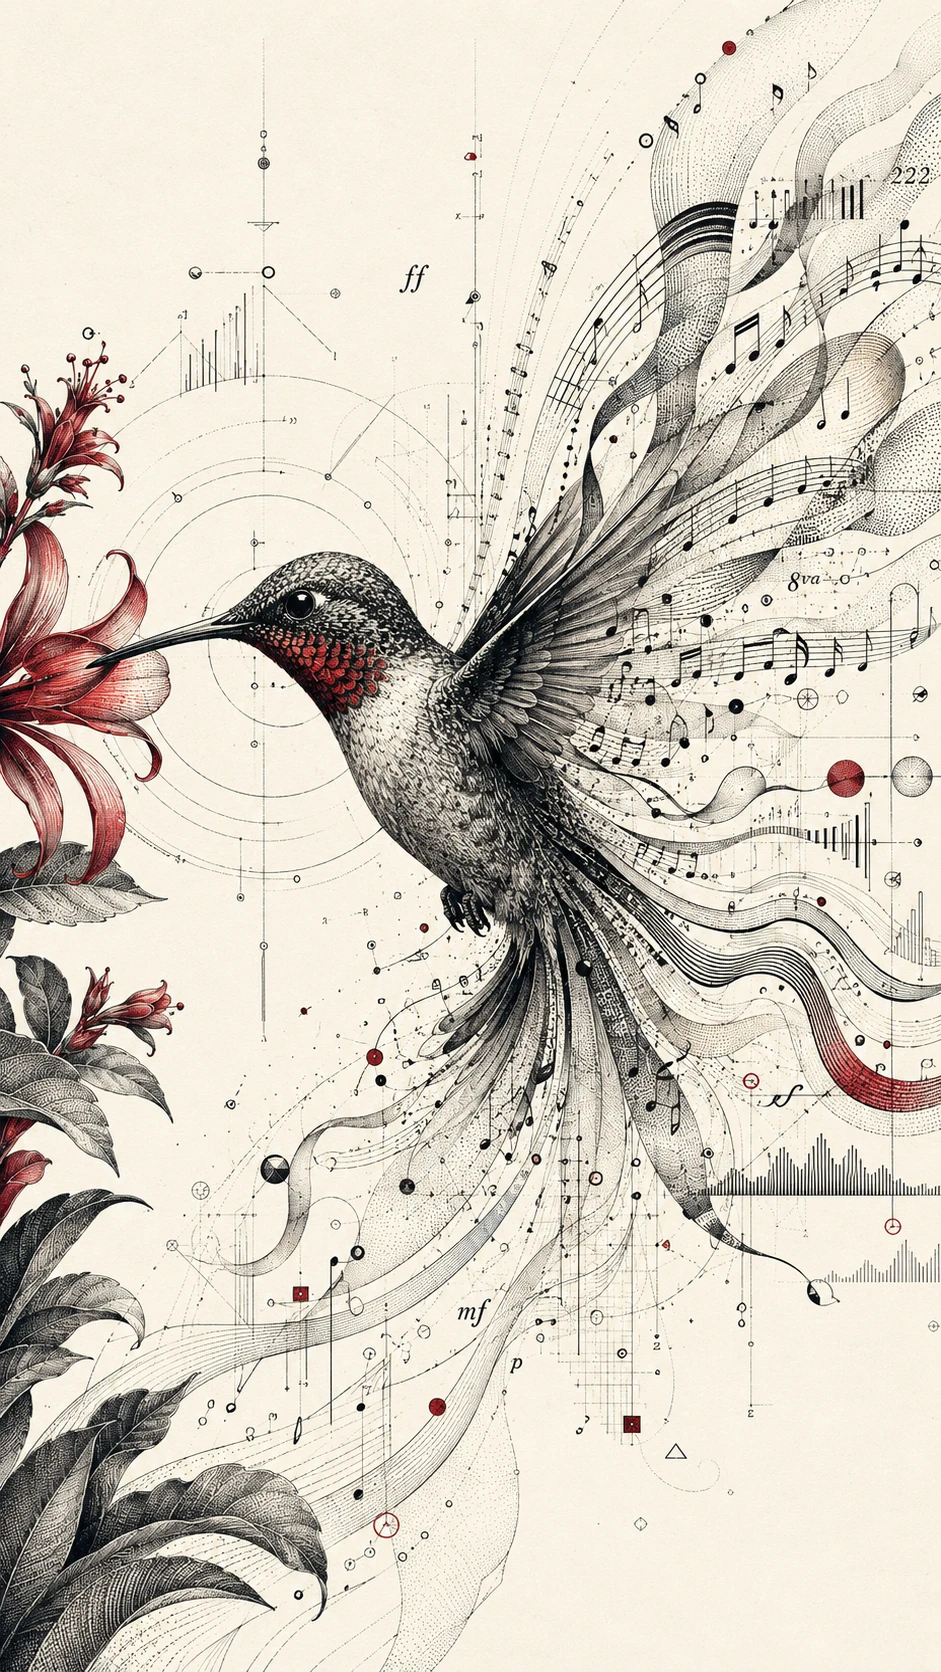
An executive dashboard is reimagined as an orchestra, with bar charts rising like cathedral organ pipes, pie charts opening into stained-glass windows, and line graphs flowing like violin strings. Familiar data visuals become parts of a single musical arrangement.
The concept blends engraved scientific illustration with surreal fine art, using stippled dots for gradients and subtle optical spirals as accents. It could suit a data-focused poster or a book cover about the links between music and information.
Creative Style & Details
The details that give this artwork its look.
Subject
An executive dashboard transforms into an orchestra, with charts taking on the forms of musical and architectural elements.
Art Style
The concept combines the precise look of engraved scientific illustration with surreal fine art.
Color Palette
Black, ivory, and crimson define the palette, setting up strong contrast across the chart-inspired forms.
Shapes & Patterns
Millions of stippled dots form gradients, while subtle optical spirals are woven into the visual design.
Create Your Own Data Orchestra Illustration
Use this artwork's visual ideas as a starting point and give the scene your own direction.
AI suggestion based on this artwork.
Related images