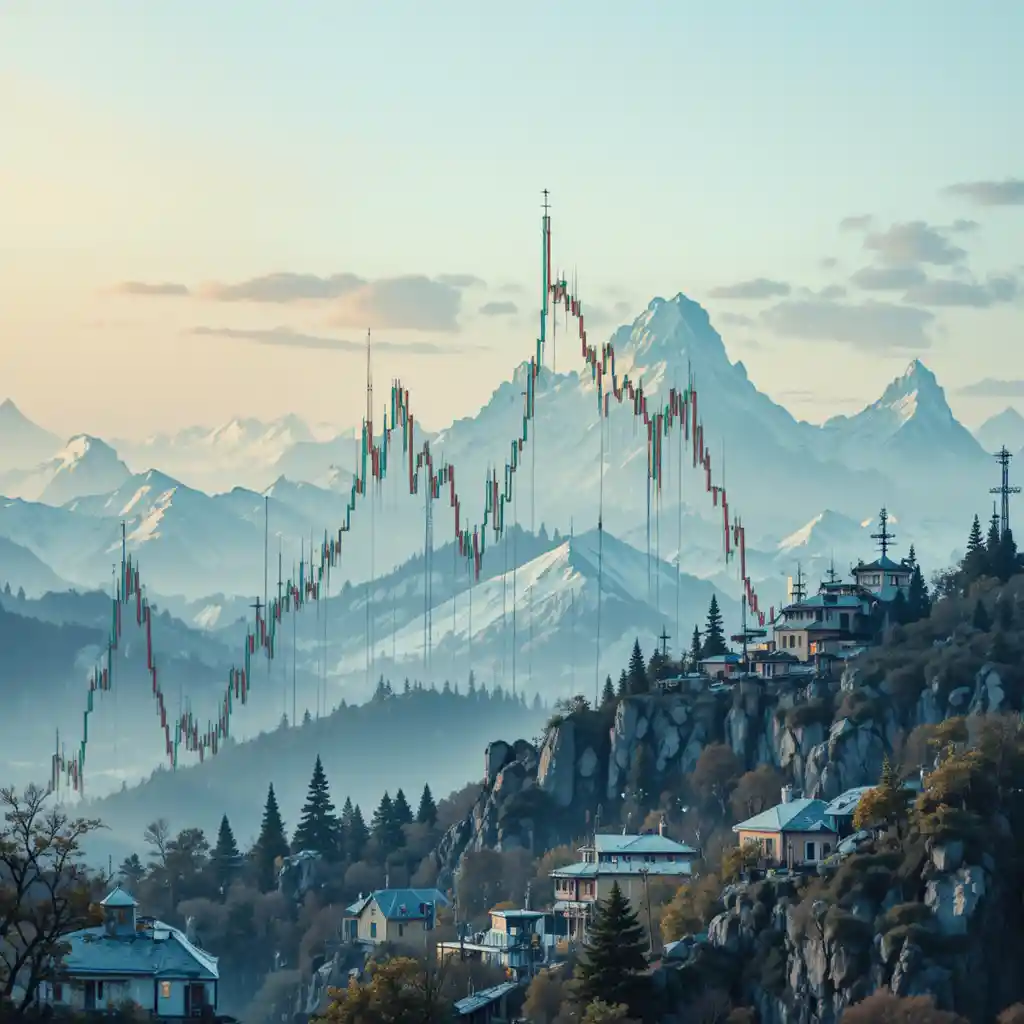
POL Price Chart With Support and Resistance Levels
Loading...
SuppWise

POL Price Chart With Support and Resistance Levels

Prompt
$POL is showing strength after holding the higher low and reclaiming the intraday support zone. Price is consolidating above the key level, indicating buyers are in control and accumulation is taking place. As long as this support holds, continuation toward the upper resistance remains likely. Patience on entry and confirmation is key to avoid fake moves. Trade Setup Entry Range: 0.1525 – 0.1540 Target 1: 0.1565 Target 2: 0.1588 Target 3: 0.1605 Stop Loss: 0.1494
Model
PicLumen Art V1
Date created
01/10/26 at 10:35 AM
Seed
755427022
Guidance Scale
1
Resolution
1024 x 1024 (1:1)

About This POL Trading Chart

A closer look at the subject, style and details in this image.

The artwork concept is a POL trading chart focused on price holding a higher low and reclaiming an intraday support zone. It shows consolidation above that level, with upper resistance targets and a stop-loss level marking the trade setup.

The graphic takes a data-focused approach to explaining a potential continuation scenario while noting the need for entry confirmation. This concept suits a trading analysis post or a market update for a finance newsletter.

Creative Style & Details

The details that give this artwork its look.

Subject

The focus is POL price action, with a higher low and reclaimed intraday support presented as signs of buyer strength.

Visual Style

A financial data visualization approach can make the technical setup and its key price levels easy to follow.

Composition

The analysis centers on consolidation above support and a possible move toward upper resistance, with entry confirmation as a key consideration.

Typography & Text

The setup includes an entry range of 0.1525 to 0.1540, three targets from 0.1565 to 0.1605, and a stop loss at 0.1494.

Create Your Own POL Trading Chart

Use this artwork's visual ideas as a starting point and give the scene your own direction.

Ideas for Your Version

AI suggestion based on this artwork.

Keep the higher low and reclaimed support zone, then change the ticker, price levels, or chart layout to create a market graphic suited to your analysis.

Related images

Marathi Letter on Rural Governance and Farmer Support
Distressed Streetwear Slogan Graphic
Romantic Typography Graphic Design
Neon Graphic Design About Life
Mobile editing tips for creating engaging short video clips
Nuclear Medicine Modern Art Graphic
Bold rap lyrics arranged as expressive urban typography
Distressed Vintage Streetwear Graphic Design
Motivational Quote Graphic with a Script Number 2
Man Writing Soulful Rap Lyrics
Bengali Durga Puja Invitation Card Design
Social Commentary Quote Graphic on Silence
US Parcel Shipping Restrictions Notice
Distressed Streetwear Typography Graphic
Red Studio Logo With Blue A on a Starry Background
Periodic Table Chemistry Infographic
Mystical Zodiac Relics with Crystals and Minerals in Graphic Design
Wordplay-Inspired Graphic Design
Lyrical Typography Graphic Design
Leucospermum Flower Vector Flyer