Periodic Table Chemistry Infographic
Loading...
Carlos Alberto González

Periodic Table Chemistry Infographic

Prompt
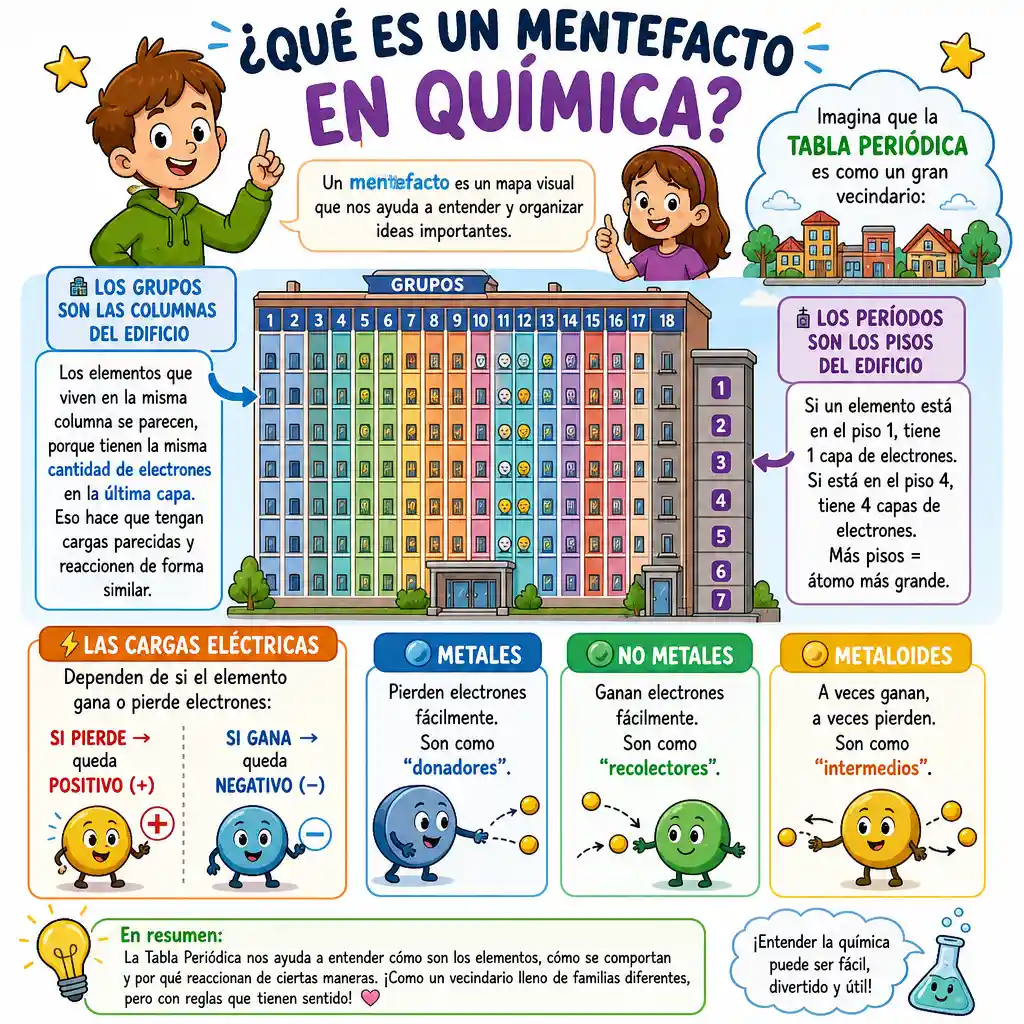
🌟 EXPLICACIÓN AMIGABLE (para chicos de 5to grado) del Mentefacto en Quimica Imagina que la Tabla Periódica es como un gran vecindario: 🏢 Los grupos son las columnas del edificio Los elementos que viven en la misma columna se parecen, porque tienen la misma cantidad de electrones en la última capa. Eso hace que tengan cargas parecidas y reaccionen de forma similar. 🛗 Los períodos son los pisos del edificio Si un elemento está en el piso 1, tiene 1 capa de electrones. Si está en el piso 4, tiene 4 capas de electrones. Más pisos = átomo más grande. ⚡ Las cargas eléctricas Dependen de si el elemento gana o pierde electrones: • Si pierde → queda positivo (+) • Si gana → queda negativo (–) 🔵 Metales Pierden electrones fácilmente. Son como “donadores”. 🟢 No metales Ganan electrones fácilmente. Son como “recolectores”. 🟡 Metaloides A veces ganan, a veces pierden. Son como “intermedios”.
Model
GPT-Image-2
Date created
07/02/26 at 9:40 AM
Seed
756664980
Guidance Scale
7.5
Resolution
1024 x 1024 (1:1)

About This Periodic Table Concept Map

A closer look at the subject, style and details in this image.

This chemistry concept map explains the periodic table through a building analogy. Groups become columns in the building, while periods become floors that represent electron shells. It also introduces positive and negative charges, and compares metals, nonmetals, and metalloids as electron donors, collectors, and intermediates.

The idea presents chemistry in a friendly, classroom-focused way for fifth-grade learners. Its building comparison and simple explanations suit a school science poster or an educational worksheet about elements and atomic structure.

Creative Style & Details

The details that give this artwork its look.

Subject

The central topic is the periodic table, with groups, periods, electron shells, charges, metals, nonmetals, and metalloids explained for young learners.

Scene & Setting

A building analogy turns groups into columns and periods into floors, linking the table's layout to electron shells in atoms.

Color Palette

Blue, green, and yellow distinguish metals, nonmetals, and metalloids, giving each category a clear color association.

Visual Style

The concept is framed as a friendly, accessible chemistry teaching graphic, using familiar comparisons to make scientific ideas easier to follow.

Create Your Own Periodic Table Concept Map

Use this artwork's visual ideas as a starting point and give the scene your own direction.

Ideas for Your Version

AI suggestion based on this artwork.

Keep the building analogy and blue, green, and yellow categories, then change the element examples or colors to make the lesson your own.

Related images

Smoke Text With Fiery Lettering on Black
Leucospermum Flower Vector Flyer
Blue and Gold Quote Background with White Script
Motivational Quote Graphic on Success Through Opposition
Minimalist Typography Design with Faint Text Outline
Hindi Anti-Drug Awareness Message Graphic
Golden Rose Typography with Red Roses
Dynamic typographic art inspired by rhythmic spoken words
Blue 2D Samurai Concept Art With Futuristic Typography
Friendship Quote Graphic Design
Distressed Streetwear Slogan Graphic
Motivational Quote Graphic About Courage and Strength
The Word Primo Spelled in Underwater Bubbles
Not for Role Models Streetwear Graphic
Quote Graphic About a Shared Life Journey
Not For Role Models Streetwear Graphic
Bold typographic artwork inspired by lyrical confidence
Neon Glitch Typography Logo Design
Punjabi Song Promo Graphic About Pride
3D Typography Poster With a Concrete Portal